
Autore: Rosanna Nicosia - Junior Researcher - GEO Economia
Abstract
On 5 December 2022 the G7, the European Union, and Australia allowed their firms to ship, insure, and finance Russian seaborne crude only if it had been sold for $60 a barrel or less. This paper assesses what the price cap had achieved by October 2026. Russia's own tax data shows the monthly average price of Urals at or below the cap in force in 14 of the 45 months from January 2023 to September 2026, and those months coincide with the EU embargo, with falling world prices, or with separate US sanctions. Over the same period a shadow fleet of several hundred tankers came to carry most Russian crude outside Western services. Drawing on Farrell and Newman's theory of weaponized interdependence, the paper treats the cap as an attempt to turn Western control of maritime services into coercive power, and proposes that such power wears off at a speed set by four conditions: the size and fiscal resilience of the target, the supply of substitutes for the controlled service, the cohesion of the sanctioning states, and their reach over ships, flags, and ports. EU legal acts, Russian official statistics, and independent tanker tracking show all four conditions at work. The paper ends with five recommendations for EU policymakers.
Keywords
Oil price cap; shadow fleet; Russia; European Union; sanctions enforcement; weaponized interdependence; maritime services; economic statecraft
1. Introduction
The price cap on Russian seaborne oil drew its force from the location of a service industry. Most of the world's tanker insurance, together with a large share of the ships, brokers, and banks that move crude by sea, sits in G7 and EU jurisdictions. Under rules in force since 5 December 2022, firms in those countries and in Australia may provide these services for Russian crude only when the cargo was bought at or below the cap, set at $60 a barrel and meant to stay at least 5% below the market price of Russian crude (Baker McKenzie, 2022). The governments involved, which call themselves the Price Cap Coalition (European Commission, n.d.), gave the cap three objectives: to keep Russian oil on the world market, to limit upward pressure on prices, and to reduce Russia's revenue (Baker McKenzie, 2022).
Nearly four years later the cap is still in force, although the coalition has reworked it several times. The European Union lowered it to $47.60 on 3 September 2025 and, through an automatic mechanism tied to market prices, to $44.10 on 1 February 2026 (European Commission, 2025a; Interfax, 2026). In July 2026 the EU suspended that mechanism until 15 July 2027, because the oil price shock that followed the closure of the Strait of Hormuz would otherwise have raised the cap (Liboreiro, 2026; Gard, 2026). The United States kept its own cap at $60 (S&P Global Commodity Insights, 2025) and turned to another tool. On 22 October 2025 it placed blocking sanctions on Rosneft and Lukoil (US Department of the Treasury, 2025), whose combined output is about half of Russian oil production (BOFIT, 2025), and during the 2026 oil shock it temporarily licensed purchases of Russian cargoes (Novaya Gazeta Europe, 2026; Outlook Business, 2026). The EU's 20th sanctions package, adopted on 23 April 2026, gave the EU a legal basis for a full ban on maritime services for Russian oil, and by the end of July the member states had still taken no decision to activate it (Hill Dickinson, 2026; Gard, 2026).
Two calculations from official data set the problem. According to the monthly prices that Russia's Ministry of Economic Development publishes for tax purposes, the cap was at or above the average Urals price in only 14 months out of 45 between January 2023 and September 2026 (Ministry of Economic Development of the Russian Federation, 2023-2026). From January to September 2026 the same series averaged $69.5 a barrel, against $58.9 in the same months of 2025, while Russia's federal revenue from oil and gas fell by 17.2% to 5.471 trillion roubles (LB.ua, 2026; Xinhua, 2026). Over the same years Russia assembled a shadow fleet, a pool of older tankers insured and flagged outside the coalition, which in December 2025 carried 74% of its seaborne crude (CREA, 2026a). The cap was in the market's range for less than a third of its life, and the pressure on Russian public finances in 2026 has come through channels that the cap does not govern.
This paper asks how long control over a network service can give sanctioning states coercive power over a large exporter, and what sets the pace at which that power fades. The cap is a convenient case. Its start date is fixed, its legal history is public, and both Russian and independent sources publish monthly data on its prices and shipping.
The analysis builds on the theory of weaponized interdependence developed by Henry Farrell and Abraham Newman, in which states with authority over the central nodes of global networks can observe the flows that pass through them or cut particular actors off (Farrell & Newman, 2019a). The cap belongs to the second type, since it made access to Western maritime services conditional on Russian compliance. Farrell and Newman warned that such structures 'may not endure forever' if they are overused, because targets and third parties can build networks of their own (Farrell & Newman, 2019b). The speed of that process, and its causes, lie outside their framework. The contribution here is to specify four conditions that govern the speed, to trace each of them through the Russian record, and to derive recommendations for EU policy. Section 2 reviews three bodies of literature, Section 3 sets out the framework and the data, Section 4 presents the evidence, Section 5 discusses the pace of decay and the main objections, Section 6 makes recommendations, and Section 7 concludes.
2. The cap in three literatures
The first studies of the cap came from economists close to its design. Simon Johnson, Lukasz Rachel, and Catherine Wolfram disclose that Wolfram served as Deputy Assistant Secretary for Climate and Energy at the US Treasury in 2021-22 and that Johnson advised informally on the policy (Johnson et al., 2023a). Their case rests on the gap between the world price and Russia's low cost of production: at a capped price Russia still has a reason to keep exporting, so the cap can cut revenue without taking barrels off the market (Johnson et al., 2023b). Henrik Wachtmeister, Johan Gars, and Daniel Spiro estimated that a cap near $50 would maximise the gains of oil importers, that each further $5 reduction would add Russian losses of about 1% of GDP, and that tighter caps would make retaliation through export cuts more likely (Wachtmeister et al., 2024).
Cardoso et al. (2025) identify a limitation shared by those early models. Each of them treats the number of tankers able to carry Russian oil outside Western services as given and unchanging. On that assumption Russia can lift only a fixed quantity without G7 ships and insurance, so a cap set below the market price leaves it with a narrow choice between selling at the capped price and not selling at all, and the cap looks powerful. Cardoso et al. replace the fixed fleet with one that grows. In their model the cap itself creates the incentive to buy more old tankers, because every barrel moved outside the Western system can be sold at the full market price, and the difference between that price and the cap is what pays for the ships. The size of the shadow fleet becomes a consequence of the cap rather than a fixed limit on Russia, and the pressure the cap can exert declines as the fleet is assembled.
Empirical work then measured what the cap did. Using Russian customs records, Babina et al. (2023) found smaller realised discounts on crude in late 2022 than quoted Urals prices implied. Spiro et al. (2025) judged the EU import embargo to have been probably the most consequential oil sanction, through the discount it forced on Russian crude and the higher transport costs it imposed, and concluded that the cap worked mainly as a partial embargo on transport that reinforced those effects.
A second body of work treats sanctions as economic war and pays attention to how targets prepare. Nicholas Mulder's history of interwar sanctions shows that the threat of blockade pushed governments towards self-reliance, with Nazi Germany planning for 'blockade-resilience', and that sanctions worked poorly against major powers such as Italy, which had prepared to withstand shortages (Mulder, 2022; Wihtol, 2022). Assessing the measures taken against Russia, Oleg Itskhoki and Elina Ribakova argue that sanctions are more effective when imposed decisively and across the board, that piecemeal measures let the target adapt step by step, and that large, globally integrated economies are harder to coerce than small, isolated ones (Itskhoki & Ribakova, 2024).
The third body of work supplies the concept that links the first two. Farrell and Newman (2019a) argue that global economic networks grow around a small number of hubs, and that states with authority over those hubs gain two kinds of power: a panopticon effect, which lets them watch the flows passing through, and a chokepoint effect, which lets them deny access. Their leading cases were financial, above all dollar clearing and the SWIFT messaging system. They also cautioned that heavy use of these powers could prompt states and firms to build alternative networks, pointing to INSTEX, the special purpose vehicle that European governments set up to route payments around the US system (Farrell & Newman, 2019b).
Together, these literatures explain why the cap could bite at first and why Russia would try to escape it. They leave open how fast the escape happens. The economic models held the shadow fleet fixed or treated its growth in general terms; the sanctions literature expects adaptation and leaves its pace unmeasured; and the literature on weaponized interdependence allows that chokepoints can erode and leaves the conditions that set the rate unspecified. Nearly four years of monthly data on the cap make it possible to trace those conditions in a single case.
3. Framework and data
The paper borrows the idea of a half-life to describe the period over which control of a network service keeps changing a target's choices before workarounds reduce its effect to the margin. The term is a heuristic for organising the comparison, and no attempt is made to estimate it as a parameter. Four conditions are expected to set the rate of decay.
The first condition is the size and fiscal resilience of the target. A large exporter with low production costs can accept a discount, keep selling, and spend part of the remaining revenue on a route around the restriction, in line with the finding of Itskhoki and Ribakova (2024) that large, integrated economies are harder to coerce.
The second is the supply of substitutes for the controlled service. When older tankers, insurance from outside the G7, accommodating flag registries, and willing buyers can all be found at a cost the target can bear, the alternative network that Farrell and Newman (2019b) anticipated can be built quickly, and the chokepoint loses force.
The third condition is the cohesion of the sanctioning states. When firms based in coalition countries keep profiting from the trade, or coalition governments choose different instruments, the chokepoint weakens from within.
The fourth condition is reach, meaning how far the enforcement of the sanctioning states can actually follow the trade. Enforcement works on two layers. The contractual layer consists of the paperwork that travels with a cargo: the insurance policy, the financing, the brokerage, and the attestation of the price paid. Sanctioning states control this layer because the firms that issue those documents are established in their own jurisdictions, which allows them to order those firms to serve only cargoes sold at or below the cap. This means that a determined target can leave this layer at a low cost, since every one of those documents has a substitute: a Russian or other non-coalition insurer can write the cover, a trader outside the G7 can handle the sale, and the cargo then sails with no Western paper attached to it and no obligation to respect the cap. The physical layer consists of the ship and of everything a ship needs: a registry willing to grant it a flag, a crew, bunker fuel, repairs, sheltered water for ship-to-ship transfers, and a terminal able to discharge it. Leaving this layer is far more expensive, because these services cannot be replaced with a signature. Sanctioning states reach into it by listing individual vessels, by closing their ports and waters to them, by designating the terminals and bunkering tankers that serve them, and by detaining ships whose flag cannot be verified. Pressure applied at the physical layer should, therefore, decay more slowly than pressure applied to contracts, and the price of that durability is enforcement which is slower, dearer, and legally more difficult, since it requires jurisdiction over ships at sea rather than instructions to companies at home.
The evidence compares the design of the cap with its outcomes from December 2022 to September 2026. Prices come from the monthly average Urals price that Russia's Ministry of Economic Development publishes for the calculation of oil taxes. Values for 2023 to 2025 are taken from the table compiled by the ConsultantPlus legal database, and values for 2026 from the Ministry's notices as published by ConsultantPlus, RIA Novosti, Profinance, NANGS, and Cbonds (Ministry of Economic Development of the Russian Federation, 2023-2026). Legal measures come from EU and US official releases and from circulars issued by marine insurers and law firms. Shipping data come from the monthly trackers of the Centre for Research on Energy and Clean Air (CREA) in Helsinki and of the KSE Institute at the Kyiv School of Economics, both based on commercial ship tracking. Fiscal data comes from the Russian Finance Ministry as reported by Reuters, Xinhua, and Bloomberg.
Yet, three limits apply. With one case, the paper can show the four conditions at work, while testing them requires comparison with chokepoints where they take different values. A monthly average price shows whether the cap fell inside the range of market prices, a narrower question than whether individual cargoes complied with it. Finally, CREA and the Russian Ministry assess Urals differently, so prices are taken only from the Ministry series and shipping shares only from CREA.
4. The record, 2022-2026
4.1 When the cap bound
On the Ministry's monthly data, the 14 months in which the Urals average sat at or below the prevailing cap fall into three episodes (Ministry of Economic Development of the Russian Federation, 2023-2026).
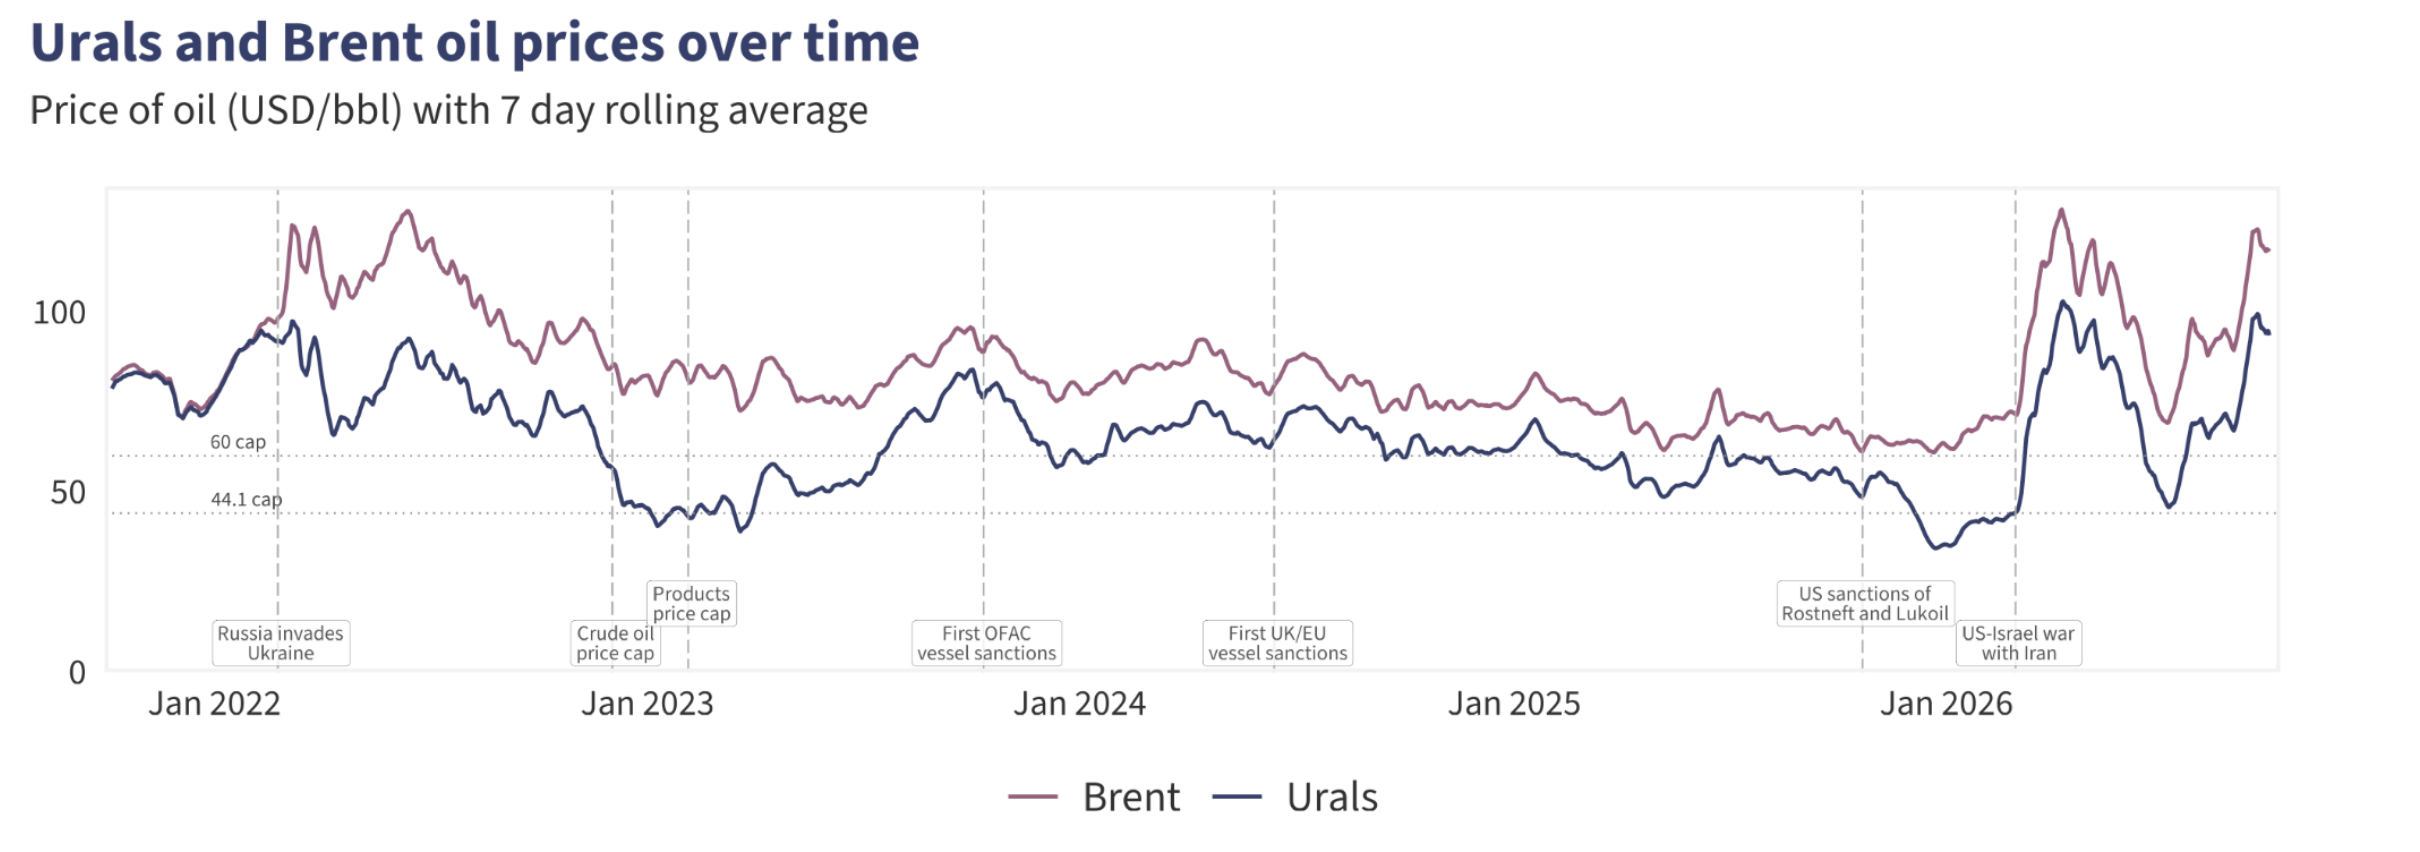
Figure 1. Average monthly price of Urals crude oil, in US dollars per barrel. Source: Centre for Research on Energy and Clean Air (CREA), September 2026: Monthly analysis of Russian fossil fuel exports and sanctions, 16 October 2026, section 'How are oil prices changing?' [B-1]. Chart available at https://energyandcleanair.org/september-2026-monthly-analysis-of-russian-fossil-fuel-exports-and-sanctions/
The first episode ran from January to June 2023, when the monthly average stayed between $48.67 and $58.97. These were the first months of the cap on crude, in force since 5 December 2022 alongside the EU embargo on seaborne crude, and of the cap on petroleum products, applied from 5 February 2023 (European Commission, n.d.); the evidence of Spiro et al. (2025) points to the embargo as the stronger force. From July 2023 to February 2025 Urals averaged above $60 in every month, reaching $83.18 in September 2023.
The second episode covered March to June and August 2025, with averages between $52.08 and $59.84. World prices were falling at the time. Brent lost nearly $15 a barrel in April 2025 on fears that tariffs would slow growth, and over the year it averaged $69, its lowest level since 2020 (US Energy Information Administration, 2026). Urals averaged $55.6 in 2025 (author's calculation from the Ministry series), about $13 below Brent, close to the gap of around $14 that the Bank of Finland's Institute for Emerging Economies reports for the previous two years (BOFIT, 2025), so the dip of 2025 followed the world price. Writing in August 2025, Laura Solanko of the Bank of Finland noted that after the recent fall in global prices the $60 cap 'was no longer binding' (Solanko, 2025).
The third episode, from November 2025 to January 2026, had a different cause. After the United States designated Rosneft and Lukoil on 22 October 2025, Indian refiners began turning away Russian cargoes and the gap between Urals and Brent widened to nearly $20 (BOFIT, 2025; Moscow Times, 2025). Argus assessed Urals at $34.52 a barrel at Novorossiysk on 16 December 2025 (Moscow Times, 2025), and the Ministry's December average of $39.18 is the lowest in the series. With the EU cap then at $47.60, Russian crude sold within it for three months.
From March 2026 the relationship reversed. Fighting between the United States and Iran from late February almost halted shipping through the Strait of Hormuz (Novaya Gazeta Europe, 2026; Business Today, 2026), and the official Urals average rose to $77.00 in March and $94.87 in April. It stood at $92.08 in September, more than twice the $44.10 cap. Because the automatic mechanism set the cap 15% below the average market price of Urals over the previous six months (European Commission, 2025a), the July 2026 review would have raised it. Ursula von der Leyen said that the mechanism 'was not made for market shocks like the one caused by the closure of the Strait of Hormuz' (Liboreiro, 2026), and the 21st package froze the cap at $44.10 until July 2027 (Gard, 2026).
Each episode had a cause outside the level of the cap: the EU embargo in 2023, the world market in 2025, and US corporate sanctions at the end of 2025. Whenever world prices rose, as from mid-2023 to early 2025 and again in 2026, the cap sat well below the market.
4.2 Size and the fiscal cushion
Let’s intend size, here, as the volume of Russia’s oil exports, and the fiscal cushion as the revenue those exports had already accumulated before the cap took effect. Together they gave the Russian state what it needed in order to build a way around the measure instead of submitting to it: time, and the money to pay for a fleet of its own. The volumes set the scale of the problem the coalition faced. Russia exported about 5.7 million barrels of oil a day at the end of 2025 (Kpler, 2025), and Rosneft and Lukoil alone produce about half of its oil (BOFIT, 2025).
The fiscal squeeze arrived in 2026. Federal oil and gas revenue fell by 17.2% between January and September, to 5.471 trillion roubles, or about $64 billion, from 6.61 trillion a year earlier (LB.ua, 2026; Xinhua, 2026). The official Urals average over those nine months was $69.5, above both the 2025 level and the budget assumption. Four factors account for the fall. The rouble was on average about 9% stronger against the dollar from January to August than a year earlier, which reduced the rouble value of each dollar of exports. Compensation paid to Russian refiners under the domestic fuel price mechanism grew as world product prices rose, and exceeded 197 billion roubles in August alone. Crude output fell from 9.24 million barrels a day in January to 8.72 million in August, according to OPEC data, while Ukrainian drone strikes forced refinery cuts and disrupted loadings at Novorossiysk. Moreover, receipts in a given month reflect the previous month's price: Bloomberg reports that August revenue was calculated at just over $59 a barrel, the July average (LB.ua, 2026; Xinhua, 2026; Bloomberg, 2026). The 2026 federal deficit is now forecast at about 3% of GDP, close to double the planned level (LB.ua, 2026). None of these channels run through the cap, which sat far below the market for most of 2026.
4.3 Substitutes: the shadow fleet
Before the numbers, the phenomenon itself deserves a proper definition. The shadow fleet is the name given to the tankers that move Russian oil without using any of the services the coalition controls. CREA, whose monthly data is used below, classifies as shadow tankers those vessels that were under sanctions on the date they loaded their cargo or that were neither owned nor insured in a G7 or partner country, which CREA calls G7+ (CREA, 2026d). In practice these are for the most part old ships, bought on the second-hand market in the years after 2022, frequently through companies registered in jurisdictions that do not disclose who owns them. They are covered by Russian or other non-coalition insurers, they sail under the flag of registries that ask few questions, and in a number of cases under flags they are not entitled to fly at all. Many of them switch off or falsify the position signals that merchant ships are required to transmit, and transfer cargo from ship to ship at sea, so that the origin of a barrel becomes difficult to establish by the time it reaches a refinery. Since none of the firms involved falls under coalition law, the sale price of the cargo no longer has to be attested to anyone, and the cap no longer reaches it. The practice was not invented for Russia, because comparable fleets had already grown around the sanctions on Iran and Venezuela. What changed after December 2022 is the scale, since the volumes Russia needed to move were far larger than anything those earlier fleets had carried, and the figures that follow measure the result.
The cap's grip depended on Russia needing Western services, and Russia invested heavily to reduce that need. By June 2024 the KSE Institute counted 435 tankers in Russia's shadow fleet, on which Russia had spent about $8.5 billion, and found that shadow tankers had carried 83% of Russian crude and 46% of its oil products in April 2024 (Hilgenstock et al., 2024). In September 2025 S&P Global counted 978 tankers in sanctioned trades for Russia, Iran, and Venezuela combined, about 18.5% of world oil tanker capacity (S&P Global Commodity Insights, 2025). The inputs could be bought: older tankers from the open market, cover from Russian insurers such as Ingosstrakh and Alfastrakhovanie, which the United States designated in January 2025 (Baltic Exchange, 2025), and flags, including false ones. CREA counted 45 shadow tankers sailing under false flags at the end of August 2026 (CREA, 2026c).
Tankers owned or insured in coalition countries remained part of the trade throughout. Solanko (2025) notes that the share of European tankers involved in Russian oil exports had risen to about 50% by the spring of 2025.
CREA's monthly data, which separate crude from oil products, show how much Russian crude now moves outside the cap. Tankers owned or insured in G7 and partner countries, which CREA calls G7+ tankers, carried 17% of Russia's seaborne crude in January 2025. Their share rose to 42% by July 2025, a change CREA attributes to frequent sanctioning of shadow vessels (CREA, 2025). It fell back to 26% in December 2025, when sanctioned shadow tankers carried 68% (CREA, 2026a), and stood at 34% in both July and August 2026 (CREA, 2026b, 2026c). Oil products follow a different pattern, with G7+ tankers carrying 72% of them in August 2026 (CREA, 2026c), so the role of the shadow fleet is concentrated in crude, the commodity covered by the $44.10 cap.
The KSE Institute's counts point the same way. In August 2026, 166 of the 258 tankers that lifted Russian oil were shadow vessels, and ships under the Russian and Sierra Leonean flags carried 55% of shadow fleet exports (KSE Institute, 2026b). The move to the Russian flag responds to enforcement. Windward reports that Russia took some 69 sanctioned tankers onto its register after November 2025, following interceptions of stateless tankers by US and European forces, and that more than one in five of the over 1,000 tankers sanctioned by Western governments now flies the Russian flag (Gidron, 2026).
4.4 Cohesion: the coalition's own seams
Chokepoint power assumes that the states controlling a node act together and that their firms stay out of the trade. In the Russian case both assumptions held only in part. In early 2026 around 20% of Russian oil exports still travelled on tankers owned or insured by EU entities, and 11 of the 15 Arc7 tankers that carry liquefied natural gas from Yamal were owned or managed by European companies, which handled more than 70% of LNG shipments between Yamal and Europe in 2025 (Majcin & Castellet Nogués, 2026).
The coalition also divided over instruments. The United States kept the $60 cap after the EU, the United Kingdom, and Canada lowered theirs (S&P Global Commodity Insights, 2025), then shifted in October 2025 to blocking sanctions on Rosneft and Lukoil; the EU's 19th package, adopted the next day, imposed its own full transaction ban on Rosneft and Gazprom Neft (European Commission, 2025b). In the 2026 oil shock the two sides moved in opposite directions. On 5 March 2026 the US Treasury authorised the sale to India of Russian oil already loaded at sea (Novaya Gazeta Europe, 2026). On 15 April Treasury Secretary Scott Bessent said that the licence would not be renewed, and on 17 April a new general licence, GL 134B, allowed buyers worldwide to purchase Russian oil loaded by that date until 16 May (Business Today, 2026; Outlook Business, 2026). The EU, for its part, froze its cap in July so that higher prices would not lift it (Gard, 2026).
Inside the EU, the unanimity rule has slowed the step that would close the gap. The 20th package was adopted on 23 April 2026 only after Hungary and Slovakia lifted their objections once deliveries through the Druzhba pipeline had resumed (Baker McKenzie, 2026). The full maritime services ban for which the package laid the legal basis was left out of the measures applied, for lack of unanimity among the member states, and tied to future coordination with the G7 (Hill Dickinson, 2026). During the negotiations on the 21st package, Greece, which operates the world's largest merchant fleet, resisted a ban on services for Russian LNG on the grounds that it would harm its shipping industry, and the decision on the oil services ban was again deferred (Kharon, 2026; Gard, 2026).
4.5 Reach: from contracts to ships
Once Russia had largely left the contractual layer, the coalition followed it to the physical one by listing individual vessels, which are then barred from EU ports and from EU maritime services. The EU's official total rose from 79 vessels after the 15th package in December 2024 to 153 in February 2025, 342 in May 2025, 444 in July 2025, 557 in October 2025, 632 in April 2026, and more than 670 after the 21st package in July 2026 (European Commission, 2024, 2025a, 2025b; Ukrainian Shipping Magazine, 2025; Council of the European Union, 2025; Baker McKenzie, 2026; Gard, 2026). Since December 2025 the EU has also added vessels between packages, and Kaja Kallas, the High Representative, announced listings 'on a rolling basis, with decisions every month' (Maritime Executive, 2025). The 20th package required due diligence and a 'no Russia' clause for sales of tankers from the EU, and designated the Karimun oil terminal in Indonesia, the first port outside Russia listed for helping to circumvent the cap (Hill Dickinson, 2026; Windward, 2026a). The 21st package listed five bunkering tankers that had refuelled designated vessels and allowed member states to confiscate and sell cargoes carried by shadow vessels they detain (Gard, 2026).
Large, sudden actions moved cargo. On 10 January 2025 the United States designated (that is, to add the name of a vessel to a sanctions list) 183 vessels, 143 of them tankers, together with Gazprom Neft and Surgutneftegas (Baltic Exchange, 2025), and over the following six months the G7+ share of Russian crude rose from 17% to 42% (CREA, 2025). The effect then faded, and by December 2025 the share was back to 26% (CREA, 2026a). Corporate sanctions followed a similar course. The share of Russian crude exports handled by the four producers under US blocking sanctions, Rosneft, Lukoil, Gazprom Neft, and Surgutneftegas, fell to 4-8% in January to March 2026. UAE-based traders such as Redwood Global Supply and Alghaf Marine, which had handled 30% of crude exports, saw their share drop to zero in April, and in the first half of May the four producers again accounted for 57% (KSE Institute, 2026a). The recovery coincided with the US licences of March to May. The EU listed Redwood Global Supply in its 21st package; Windward describes it as a trader used to evade sanctions on Rosneft and Lukoil (Windward, 2026b).
Listed tankers kept working: drawing on CREA data, BOFIT (2025) reports that vessels on sanctions lists carried a steeply rising part of Russia's crude exports during 2025. Interception at sea has been national and piecemeal, since vessel seizures fall outside the competence of the EU (Majcin & Castellet Nogués, 2026). On 7 January 2026 US forces, with British support, seized the Marinera, formerly the Bella 1, in the North Atlantic; the tanker had moved to the Russian register during a pursuit that began off Venezuela (The National, 2026). On 22 January the French Navy intercepted the Grinch in the Alboran Sea; the tanker had been sanctioned by the United States, the EU, and the United Kingdom and was flying a false Comoros flag (Maritime Executive, 2026). On 28 February Belgian forces, supported by France, boarded the EU-listed Ethera in the Belgian exclusive economic zone and escorted it to Zeebrugge, citing a false Guinean flag (USNI News, 2026). A genuine Russian flag removes the ground on which the French and Belgian authorities relied, which helps to explain why Russia has been moving sanctioned tankers onto its own register (Gidron, 2026).
5. The half-life of the cap
Taken together, the evidence describes a chokepoint whose full force lasted months. In the first half of 2023, with the cap and the EU embargo newly in force, Urals stayed below $60. By April 2024 shadow tankers carried 83% of Russian crude, and for twenty consecutive months from July 2023 Urals never averaged below $60. Three of the four conditions favoured Russia. Its size and the commodity windfall of 2022 bought time; the inputs for a parallel fleet were available at a price it could pay; and the coalition leaked through its own shipowners, its divergent instruments, and its rule of unanimity. The fourth condition, reach at the physical layer, is the one the coalition has built up since 2024, and the data shows its pattern. Large and sudden actions moved cargo back to compliant tankers, and the effect wore off within months as Russia adjusted.
The sequence of instruments since 2023 fits this account. The coalition lowered the cap, listed vessels, blocked Russia's largest producers, made the cap adjust automatically, froze it, and drafted a services ban. Each step followed the weakening of the one before. If the sequence is a series of replacements, each prompted by decay, then every new instrument, a services ban included, will lose force at a rate set by the same four conditions.
Three objections can be raised. The first is that the cap did what its designers intended, by acting as a partial transport embargo that raised Russia's costs and discounts (Spiro et al., 2025). The account here accepts this finding and reads the shift from price ceiling to cost imposition as the decay itself. The second is that the fall in Russian oil and gas revenue in 2026 shows the sanctions at last working. The revenue data attributes the fall to the exchange rate, refinery compensation, lower output, and the timing of taxes, in a year when Urals traded far above the cap, so the share of the cap in the outcome is small. The third objection is methodological. One case cannot test four conditions, and conditions drawn from a case will fit it. The point is fair, and the framework needs comparison with chokepoints where the conditions differ. Dollar clearing, the main case of Farrell and Newman (2019a), is the obvious comparison: if substitutes there are scarcer than for tanker insurance, the second condition predicts a slower decay.
6. Recommendations for EU policymakers
Five recommendations follow from the analysis. They aim to slow the decay of the chokepoints the EU still controls and to move pressure to the physical layer, where Russia's workarounds cost more.
First, the Commission and the Council should judge the oil sanctions by Russian revenue and export volumes, and treat the cap level as one indicator among several. The Russian government's own monthly Urals series, combined with the CREA and KSE tanker data, would support a public quarterly assessment of how often the cap binds and why. The 2025 record suggests that broad and sudden designations move more cargo than a steady flow of small ones, which is consistent with the case that Itskhoki and Ribakova (2024) make for decisive measures.
Second, the EU should decide on the maritime services ban whose legal basis it adopted in April 2026, coordinating with the G7 as the 20th package foresees. A ban on paper would repeat the weakness of the cap, so it should come with checks on the insurance documents of tankers in EU waters, systematic port state control, and wider use of the power, created by the 21st package, to confiscate cargoes from detained shadow vessels.
Third, sanctions should target the inputs of the parallel fleet. The listing of bunkering tankers and of the Karimun terminal points in this direction, as does the 21st package's designation of Suniel Kumar, whom Windward (2026b) describes as the architect of a network of fraudulent ship registries used by sanctioned tankers . Further steps could include listing the registries themselves, making port access conditional on verified protection and indemnity cover, and pressing flag states through the International Maritime Organization to deregister sanctioned tankers.
Fourth, the EU should close its own gaps. A deadline for ending the carriage of Russian crude by EU-owned and EU-insured tankers would address the roughly 20% of exports still moving on such ships (Majcin & Castellet Nogués, 2026). The 20th package's ban on services for LNG tankers serving Russia, due to extend to non-Russian vessels from 1 January 2027 (Skadden, 2026), should stay on schedule and be applied to the European-managed Arc7 tankers that serve Yamal. Divergence with the United States, which kept a $60 cap and in 2026 temporarily licensed purchases of Russian oil while the EU held its cap, calls for a standing transatlantic procedure for coordinating any sanctions relief during market shocks.
Fifth, the EU needs an agreed rule for oil price shocks. The cap exists to avoid a spike in world prices, yet the automatic mechanism had no provision for one, as von der Leyen acknowledged when the freeze was proposed (Liboreiro, 2026). A rule agreed in advance, for example suspending upward adjustments when Brent moves beyond a set margin within a quarter, and coordinated with producers that hold spare capacity, would let the EU keep pressure on Russian revenue without improvising in a crisis.
7. Conclusion
The Russian oil price cap was the first attempt to set a ceiling on a major producer's export price by controlling the services that carry its oil. On the Russian government's own data, Urals traded within the cap in 14 of 45 months, and each of those months fell within a period of EU embargo, falling world prices, or US corporate sanctions. Russia built a fleet of several hundred tankers outside Western services, and by 2026 the coalition relied more on vessel listings, corporate sanctions, and boarding parties than on the price ceiling. The fiscal pressure on Russia in 2026 comes mainly from a strong rouble, compensation to refiners, and damage to its oil industry.
For the theory of weaponized interdependence, the case suggests that the coercive power of a chokepoint wears off at a pace governed by how large the target is, how easily the controlled service can be replaced, how united the sanctioning states remain, and how far their enforcement reaches into shipping and ports. The EU has applied comparable chokepoints against Russia in banking and technology (European Commission, 2025a), and the same four conditions can be used to judge in advance how long each will hold. For the cap itself, three indicators will show in 2027 whether the decay can be slowed: the share of Russian crude carried by G7+ tankers, the number of shadow tankers still loading Russian oil each month, and whether the maritime services ban moves from legal text to enforcement.
Source and information classification
Reliability of the source | ||
A | Reliable | No doubt about authenticity, reliability or competence; a history of complete reliability. |
B | Normally reliable | Minor doubts about authenticity, reliability or competence; a history of valid information in most cases. |
C | Fairly reliable | Doubts about authenticity, reliability or competence; has nonetheless provided valid information in the past. |
D | Normally not reliable | Significant doubts about authenticity, reliability or competence; has nonetheless provided valid information in the past. |
E | Unreliable | Lack of authenticity, reliability and competence; a history of invalid information. |
F | Cannot be judged | No basis exists for assessing the reliability of the source. |
Content of the information | ||
1 | Confirmed | Confirmed by other independent sources; logical in itself; consistent with other information on the subject. |
2 | Presumably true | Not confirmed; logical in itself; consistent with other information on the subject. |
3 | Possibly true | Not confirmed; reasonably logical in itself; agrees with some other information on the subject. |
4 | Uncertain | Not confirmed; possible but not logical in itself; no other information on the subject. |
5 | Improbable | Not confirmed; not logical in itself; contradicted by other information on the subject. |
6 | Cannot be judged | No basis exists for assessing the validity of the information. |
Babina, T., Hilgenstock, B., Itskhoki, O., Mironov, M., & Ribakova, E. (2023). Assessing the impact of international sanctions on Russian oil exports (CEPR Discussion Paper No. 17957). Centre for Economic Policy Research. https://cepr.org/publications/DP17957 [B-2]
Baker McKenzie. (2022). G7 sets price cap for Russian oil at USD 60 per barrel. Global Sanctions and Export Controls Blog. https://sanctionsnews.bakermckenzie.com/g7-sets-price-cap-for-russian-oil-at-usd-60-per-barrel/ [B-1]
Baker McKenzie. (2026, April 24). EU implements 20th sanctions package against Russia. Global Sanctions and Export Controls Blog. https://sanctionsnews.bakermckenzie.com/eu-implements-20th-sanctions-package-against-russia/ [B-1]
Baltic Exchange. (2025, January 10). US sanctions against 183 vessels, 10 January 2025. https://www.balticexchange.com/kyc/en/news-and-events/news/kyc-news/2025/us-sanctions-january-25.html [B-1]
Bloomberg. (2026, September 5). Russia's oil revenue sinks to 6-month low. Rigzone. https://www.rigzone.com/news/wire/russias_oil_revenue_sinks_to_6_month_low-05-sep-2026-184544-article/ [B-2]
BOFIT. (2025, December 5). New sanctions reduce export price of Russian oil (BOFIT Weekly Review 49/2025). Bank of Finland Institute for Emerging Economies. https://www.bofit.fi/en/monitoring/weekly/2025/vw202549_1/ [A-2]
Business Today. (2026, April 18). West Asia conflict: US allows India to purchase Russian oil without sanctions, here's why. https://www.businesstoday.in/amp/india/story/west-asia-conflict-us-allows-russian-oil-purchases-again-with-new-30-day-waiver-526305-2026-04-18 [C-2]
Cardoso, D. S., Salant, S. W., & Daubanes, J. (2025). The dynamics of evasion: The price cap on Russian oil exports and the amassing of the shadow fleet [Working paper]. https://www.researchgate.net/publication/387794109_The_Dynamics_of_Evasion_The_Price_Cap_on_Russian_Oil_Exports_and_the_Amassing_of_the_Shadow_Fleet[B-2]
Centre for Research on Energy and Clean Air (CREA). (2025, August 12). July 2025: Monthly analysis of Russian fossil fuel exports and sanctions. https://energyandcleanair.org/july-2025-monthly-analysis-of-russian-fossil-fuel-exports-and-sanctions/ [B-1]
Centre for Research on Energy and Clean Air (CREA). (2026a, January 13). December 2025: Monthly analysis of Russian fossil fuel exports and sanctions. https://energyandcleanair.org/december-2025-monthly-analysis-of-russian-fossil-fuel-exports-and-sanctions/ [B-1]
Centre for Research on Energy and Clean Air (CREA). (2026b, August 10). July 2026: Monthly analysis of Russian fossil fuel exports and sanctions. https://energyandcleanair.org/july-2026-monthly-analysis-of-russian-fossil-fuel-exports-and-sanctions/[B-1]
Centre for Research on Energy and Clean Air (CREA). (2026c, September 10). August 2026: Monthly analysis of Russian fossil fuel exports and sanctions. https://energyandcleanair.org/august-2026-monthly-analysis-of-russian-fossil-fuel-exports-and-sanctions/[B-1]
Centre for Research on Energy and Clean Air (CREA). (2026d, October 16). September 2026: Monthly analysis of Russian fossil fuel exports and sanctions. https://energyandcleanair.org/september-2026-monthly-analysis-of-russian-fossil-fuel-exports-and-sanctions/ [B-1]
Council of the European Union. (2025, May 20). Russia's war of aggression against Ukraine: EU agrees 17th package of sanctions [Press release]. https://www.consilium.europa.eu/en/press/press-releases/2025/05/20/russia-s-war-of-aggression-against-ukraine-eu-agrees-17th-package-of-sanctions/ [A-1]
European Commission. (n.d.). Price Cap Coalition statements and guidance. https://finance.ec.europa.eu/publications/price-cap-coalition-statements-and-guidance_en [A-1]
European Commission. (2024, December 16). EU adopts 15th sanctions package against Russia for its continued illegal war against Ukraine. https://finance.ec.europa.eu/news/eu-adopts-15th-sanctions-package-against-russia-its-continued-illegal-war-against-ukraine-2024-12-16_en [A-1]
European Commission. (2025a, July 18). EU adopts 18th package of sanctions against Russia. https://finance.ec.europa.eu/news/eu-adopts-18th-package-sanctions-against-russia-2025-07-18_en [A-1]
European Commission. (2025b, October 23). EU adopts 19th package of sanctions against Russia. https://finance.ec.europa.eu/news/eu-adopts-19th-package-sanctions-against-russia-2025-10-23_en [A-1]
Farrell, H., & Newman, A. L. (2019a). Weaponized interdependence: How global economic networks shape state coercion. International Security, 44(1), 42-79. https://doi.org/10.1162/isec_a_00351 [A-1]
Farrell, H., & Newman, A. L. (2019b, July 31). Introducing a new paper on 'weaponized interdependence'. Lawfare. https://www.lawfaremedia.org/article/introducing-new-paper-weaponized-interdependence [B-1]
Gard. (2026, July 30). 07/2026 EU sanctions: 21st sanctions package against Russia [Circular]. https://www.gard.no/en/circulars/07-2026-eu-sanctions-21st-sanctions-package-against-russia/ [B-1]
Gidron, Z. (2026, July 19). Russia is the leading flag for shadow fleet tankers. Windward. https://windward.ai/blog/russia-is-the-leading-flag-for-shadow-fleet-tankers/ [B-2]
Hilgenstock, B., Hrybanovskii, O., & Kravtsev, A. (2024). Assessing Russia's shadow fleet: Initial build-up, links to the global shadow fleet, and future prospects. KSE Institute. https://sanctions.kse.ua/en/assessing-shadow-fleet-initial-build-up-links-to-the-global-shadow-fleet-and-future-prospects/ [B-1]
Hill Dickinson. (2026). Sanctions: EU approves 20th package against Russia - maritime services ban on hold. https://www.hilldickinson.com/our-view/articles/sanctions-eu-approves-20th-package-against-russia-maritime-services-ban-on-hold/ [B-1]
Interfax. (2025, September 9). Russia to plan 2026 budget revenues based on oil price of $59/barrel - Siluanov. https://interfax.com/newsroom/top-stories/113721/ [C-2]
Interfax. (2026, January 15). EU to lower price cap for Russian oil to $44.10/bbl as of Feb 1. https://interfax.com/newsroom/top-stories/115637/ [C-1]
Itskhoki, O., & Ribakova, E. (2024). The economics of sanctions: From theory into practice. Brookings Papers on Economic Activity, 55(2), 425-497. [A-2]
Johnson, S., Rachel, L., & Wolfram, C. (2023a). A theory of price caps on non-renewable resources (NBER Working Paper No. 31347). National Bureau of Economic Research. https://www.nber.org/system/files/working_papers/w31347/w31347.pdf [B-2]
Johnson, S., Rachel, L., & Wolfram, C. (2023b). Design and implementation of the price cap on Russian oil exports. Journal of Comparative Economics, 51(4), 1244-1252. [B-2]
Kharon. (2026, July). EU's 21st sanctions package freezes oil price cap, hits Russia with most listings in 4 years. https://www.kharon.com/brief/eu-russia-21st-sanctions-package-oil-price-cap [B-2]
Kpler. (2025, December 16). Abandoning the price cap would expand the shadow fleet and reshape tanker markets. https://www.kpler.com/blog/abandoning-the-price-cap-would-expand-the-shadow-fleet-and-reshape-tanker-markets [B-2]
KSE Institute. (2026a, June 8). Russian oil tracker, May 2026. Kyiv School of Economics. https://kse.ua/about-the-school/news/russian-oil-tracker-may-2026-us-sanctioned-rosneft-and-lukoil-regain-control-over-exports-as-their-share-rises-to-57/ [B-1]
KSE Institute. (2026b, October 8). Russian shadow fleet tracker, September 2026. Kyiv School of Economics. https://kse.ua/about-the-school/news/russian-shadow-fleet-tracker-september-2026-shadow-fleet-shipments-of-crude-oil-and-oil-products-from-baltic-sea-ports-rose-16-as-russias-overall-seaborne-oil-exports-fell/ [B-1]
LB.ua. (2026, October 5). Russia's oil and gas tax revenues fall 17% in Jan-Sep 2026, Reuters says. https://en.lb.ua/news/2026/10/05/44162_reuters_russias_energy_revenues.html [C-2]
Liboreiro, J. (2026, June 9). EU proposes new sanctions on Russian oil, 'shadow fleet', fisheries and soldiers. Euronews.https://www.euronews.com/my-europe/2026/06/09/eu-proposes-new-sanctions-on-russian-oil-shadow-fleet-fisheries-and-soldiers [C-1]
Majcin, J., & Castellet Nogués, E. (2026, March 4). Strong on paper, weak at sea: The blind spots of the maritime services ban [Commentary]. European Policy Centre. https://www.epc.eu/publication/strong-on-paper-weak-at-sea-the-blind-spots-of-the-maritime-services-ban/ [B-2]
Maritime Executive. (2025, December 18). EU sanctions 41 shadow fleet vessels and plans monthly follow-up. https://news.maritime-executive.com/article/eu-sanctions-41-shadow-fleet-vessels-and-plans-monthly-follow-up [C-1]
Maritime Executive. (2026, January 22). France seizes sanctioned shadow tanker in Mediterranean. https://maritime-executive.com/article/france-seizes-sanctioned-shadow-tanker-in-mediterranean [C-1]
Moscow Times. (2025, December 19). Russian oil prices sink below $35 per barrel. https://www.themoscowtimes.com/2025/12/19/russian-oil-prices-sink-below-35-per-barrel-a91496 [C-2]
Mulder, N. (2022). The economic weapon: The rise of sanctions as a tool of modern war. Yale University Press. [A-1]
Novaya Gazeta Europe. (2026, March 6). US to let India buy millions of barrels of Russian oil from vessels stranded by Iran war. https://novayagazeta.eu/amp/en/articles/2026/03/06/us-to-let-india-buy-millions-of-barrels-of-russian-oil-from-vessels-stranded-by-iran-war-en-news [C-2]
Outlook Business. (2026, April 18). US renews sanctions waiver for purchase of Russian oil. https://www.outlookbusiness.com/economy-and-policy/us-renews-sanctions-waiver-for-purchase-of-russian-oil [C-2]
S&P Global Commodity Insights. (2025, September 3). Factbox: Shadow fleet expands to maintain sanctioned oil flows. https://www.spglobal.com/energy/en/news-research/latest-news/crude-oil/090325-factbox-shadow-fleet-expands-to-maintain-sanctioned-oil-flows [B-1]
Skadden. (2026, May). EU adopts 20th Russia sanctions package. Skadden, Arps, Slate, Meagher & Flom. https://www.skadden.com/insights/publications/2026/05/eu-20th-sanctions-package [B-1]
Solanko, L. (2025, August 8). New oil price cap adds to Russia's economic distress. BOFIT blog, Bank of Finland Bulletin. https://www.bofbulletin.fi/article/bofit-blog/2025/new-oil-price-cap-adds-to-russia-s-economic-distress/ [A-2]
Spiro, D., Wachtmeister, H., & Gars, J. (2025). Assessing the impacts of oil sanctions on Russia. Energy Policy, 206, 114739. [A-2]
The National. (2026, January 7). US seizing Venezuela-linked oil tanker in Atlantic after weeks-long pursuit. https://www.thenationalnews.com/news/us/2026/01/07/us-seizing-venezuela-linked-oil-tanker-in-atlantic-after-weeks-long-pursuit/ [C-2]
Ukrainian Shipping Magazine. (2025, February 24). The EU Council has imposed sanctions against 74 vessels of the 'shadow fleet'. https://en.usm.media/the-eu-council-has-imposed-sanctions-against-74-vessels-of-the-shadow-fleet/ [C-2]
US Department of the Treasury. (2025, October 22). Treasury sanctions major Russian oil companies, calls on Moscow to immediately agree to ceasefire [Press release]. https://content.govdelivery.com/accounts/USTREAS/bulletins/3f8422d [A-1]
US Energy Information Administration. (2026, January 5). Crude oil prices fell in 2025 amid oversupply. Today in Energy. https://www.eia.gov/todayinenergy/detail.php?id=66944 [A-1]
USNI News. (2026, March 2). Belgian, French forces seize Russian 'shadow fleet' tanker in North Sea. https://news.usni.org/2026/03/02/belgian-french-forces-seize-russian-shadow-fleet-tanker-in-north-sea [A-1]
Wachtmeister, H., Gars, J., & Spiro, D. (2024). The price cap on Russian oil: A theoretical and quantitative analysis (SSRN Working Paper No. 4986966). https://ssrn.com/abstract=4986966 [B-2]
Wihtol, R. (2022, August 12). From the bookshelf: 'The economic weapon: The rise of sanctions as a tool of modern war'. The Strategist, Australian Strategic Policy Institute. https://www.aspistrategist.org.au/from-the-bookshelf-the-economic-weapon-the-rise-of-sanctions-as-a-tool-of-modern-war/ [B-2]
Windward. (2026a). The EU's 20th Russia sanctions package and its maritime impact. https://windward.ai/blog/the-eus-20th-sanctions-package-and-what-it-means/ [B-2]
Windward. (2026b, July 27). EU's 21st sanctions package: Full maritime services ban shelved. https://windward.ai/blog/eus-21st-sanctions-package-full-maritime-services-ban-shelved/ [B-2]
Xinhua. (2026, October 9). Russia's oil, gas revenues fall 17.2 pct in Jan-Sept (C. Chen). The Star. https://www.thestar.com.my/news/world/2026/10/10/russia039s-oil-gas-revenues-fall-172-pct-in-jan-sept [C-2]
Cover Image: photo by AMELIE 2 & NS CHAMPION, via Wikimedia Commons.